
Let’s face it, most of us didn’t become content marketers because we love crunching numbers. But as we know, the data don’t lie! And when it comes to B2B content writing, there’s a lot of data to mine.
The key is knowing what metrics to look at and understanding how they can inform and improve your B2B content marketing. To be clear, improvement doesn’t necessarily mean just writing better future content, you can also use these data points to tweak existing content.
So much content marketing data, so little time
Admittedly, Google Analytics can lead you down a rabbit hole if you let it. To help you make sense of it, here are a few helpful tips from our healthcare tech marketing agency for reviewing metrics and how to use that data.
Organic traffic
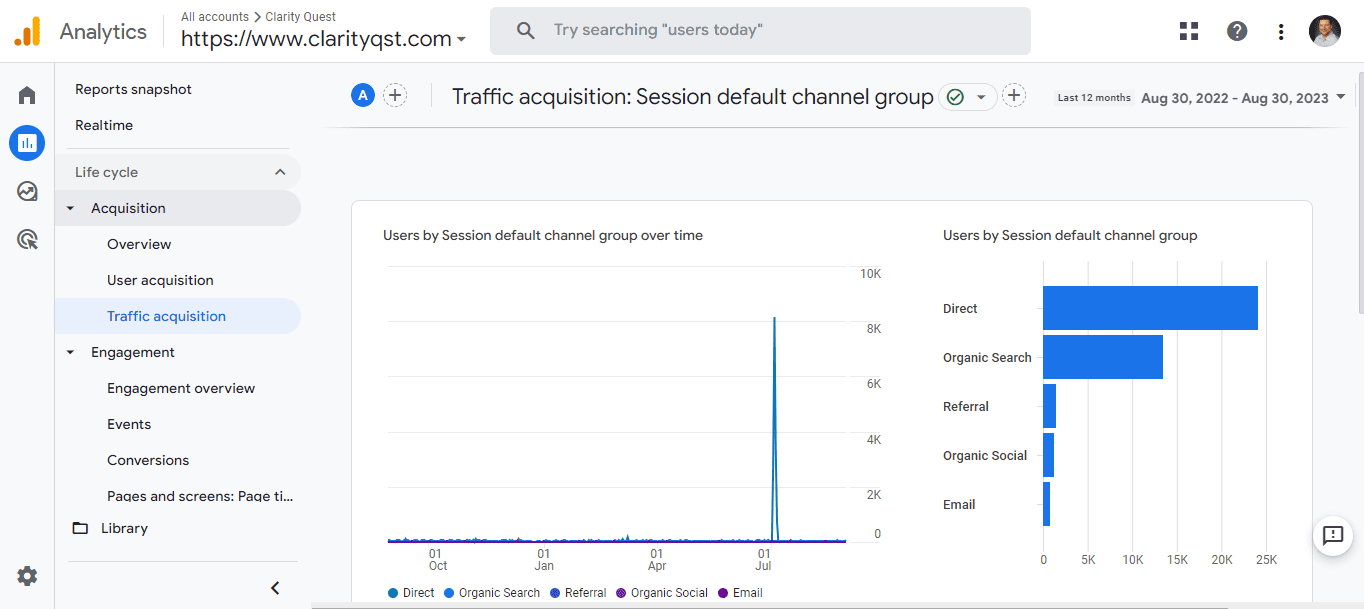
At the most basic level, organic traffic volume to a piece of content gives you great insight into what’s resonating with your website visitors.
Every quarter, I look at our website’s top ten most visited content pages to determine commonalities. The purpose is to identify what is attracting users:
- Catchy headline?
- Trending topic?
- How-to tips?
- Case study with results?
This is also why A/B testing of headlines and different formats is just as important for website content as email subject lines and social media posts. It’s worth figuring out what’s capturing the interest of your audience.
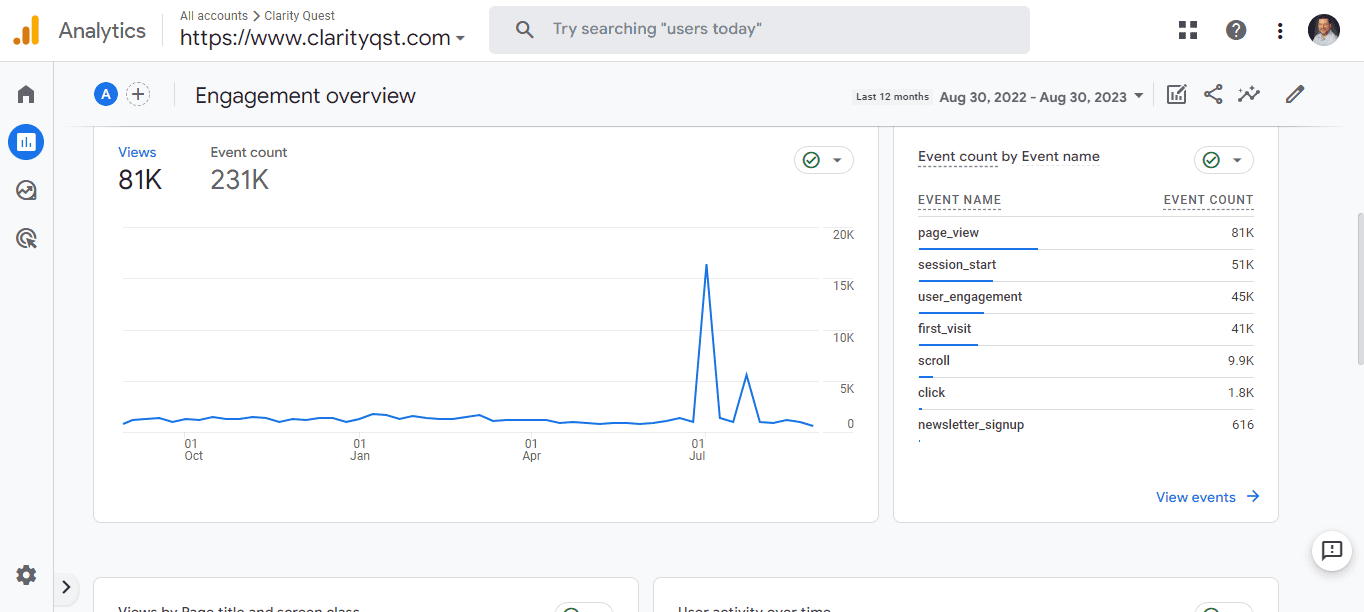
Average time on page
Sticky content is what we should all aim to create, but what exactly is it, and how do you determine it with data? This is why average time on a page is one of my favorite metrics.
Here are the three data points I regularly review:
- The five content pages with the highest average time on page
- The traffic and acquisition sources of the content with the highest average time on page
- Where do the five pieces of content with the highest average time on page rank within the website’s most visited pages, or if they even make it into the top 25?
Now, here’s an example of how to use one of those data points. If a content page has an above-average time on page but low organic traffic, here are some ideas to get more bang for your buck:
- Revisit the SEO title tag and meta description
- Cross-link to the piece from other relevant and more highly trafficked webpages
- Promote it on your socials with some relevant hashtag
You have the data that shows people want to read the content, so your job is to make it easier for more people to find it.
Google Search Console performance report
This report is one of the best ways to identify any gaps in your existing content strategy. It provides the web pages that receive the most impressions and clicks via Google organic search.
What you should look for are those pages with a high number of impressions but a low click-through rate.
It suggests that users see your page in search results but do not find it compelling enough to click on it. Similar to the previous suggestions, rewriting the title tags and meta descriptions and improving the overall quality of these pages can help increase click-through rates—all without having to reinvent the wheel, or at least a new piece of content.
Edit your B2B content with data
As a writer, first and foremost, one of the most surprising things I discovered about data is how to use it for editing and refining. Marketers are all about repurposing content across channels, but we need to focus on getting more bang for our buck on underperforming content, too.
If you need the time or help to make sense of your digital health company’s content marketing analytics, our healthcare tech marketing agency can help!
